
You have loaded the data. Now it is time to create sheets and visualizations. Dashboard design involves using the right objects in the right way, and making the sheets well structured and user-friendly.
This app will be fairly simple, but you will learn some basic design principles that are good to know.
If you want to build an app of your own, and want some inspiration, you should visit the Qlik website. You can find a large number of apps serving a wide variety of purposes there.This is useful if you are looking for a template when you want to design your own app.
If you are looking for assistance in creating analyses, you can use Insight Advisor . Insight Advisor helps you create meaningful charts and analyses from your data. You can create visualizations by selecting the analysis type you want to use and then select data to include in the analysis. You can also create visualizations from your queries using search-based analytics.
The app that you are building will contain seven sheets:
You will build the first four sheets manually. The last two sheets you will build using Insight Advisor .
You will use a combination of standard edit mode and the advanced edit mode. Standard mode helps you create content quickly, while advanced mode lets you fine tune options in visualizations and do a more detailed layout of sheet objects. Advanced mode also gives you the option to create chart expressions.
Do the following:
The following screen shots show how your app will appear when you complete this tutorial.
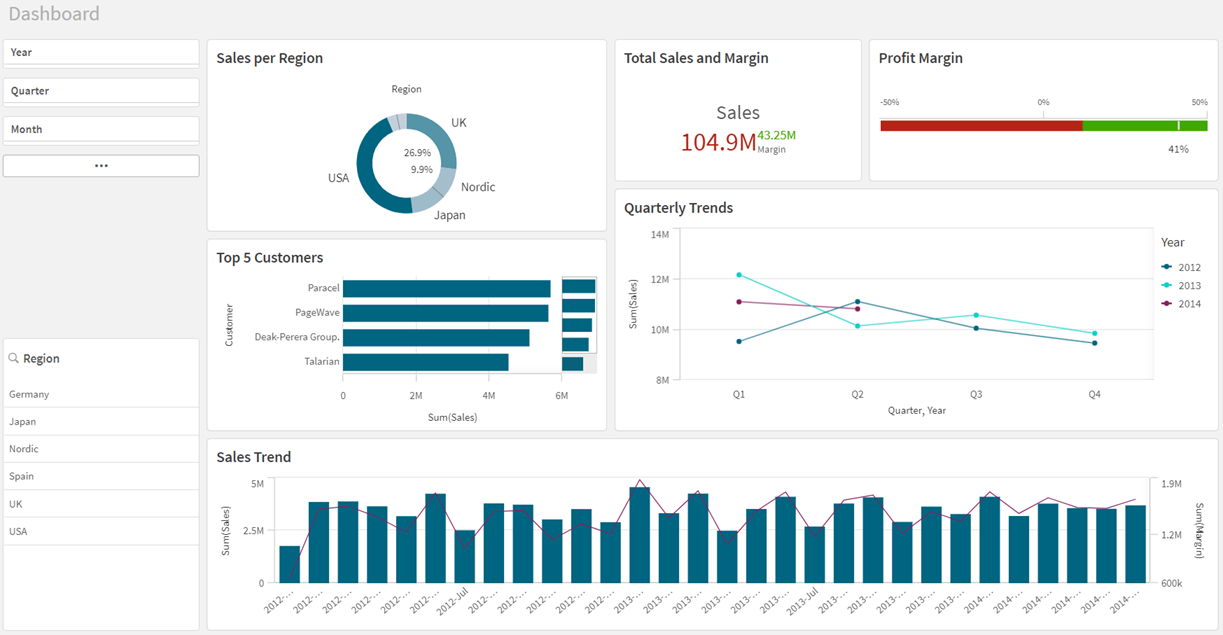

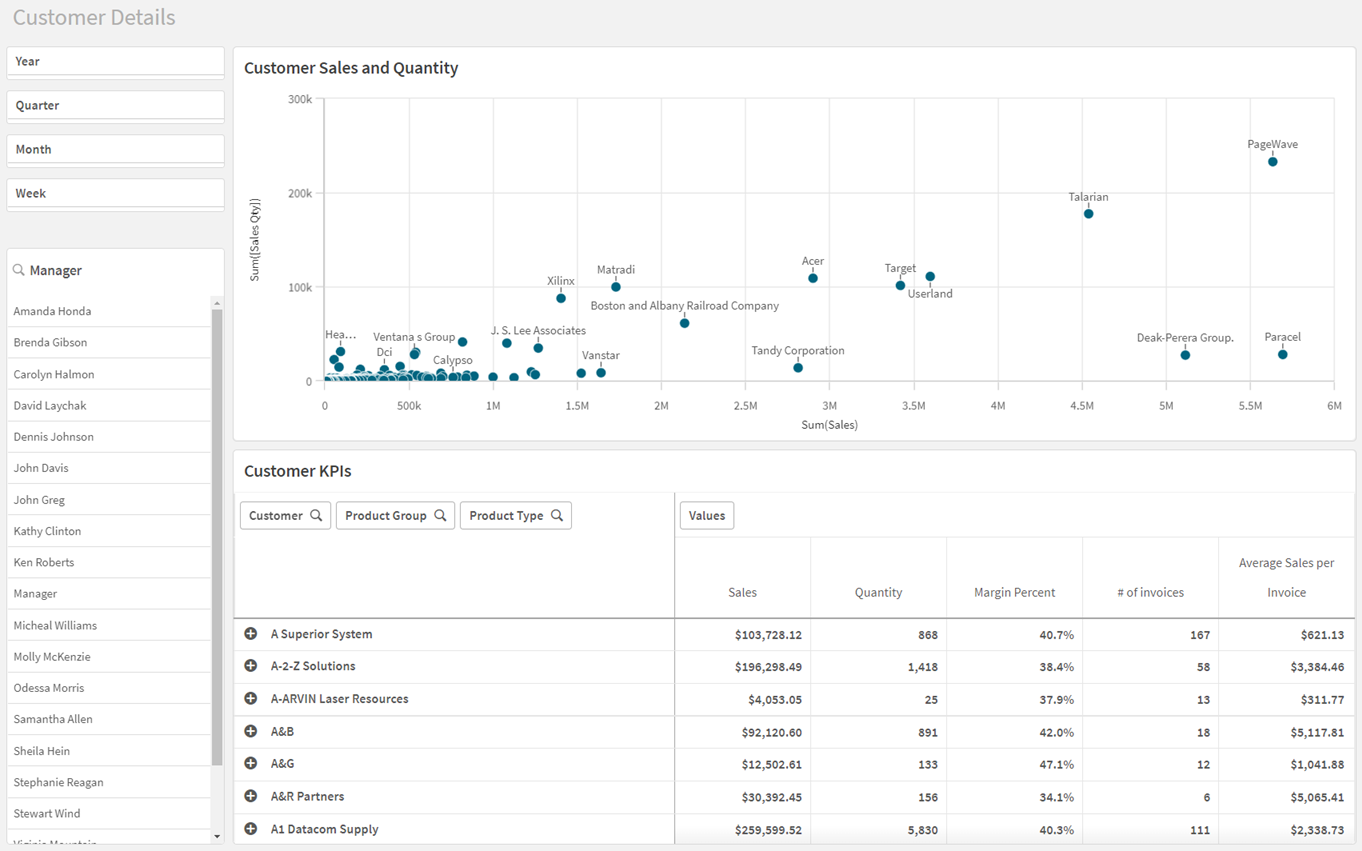
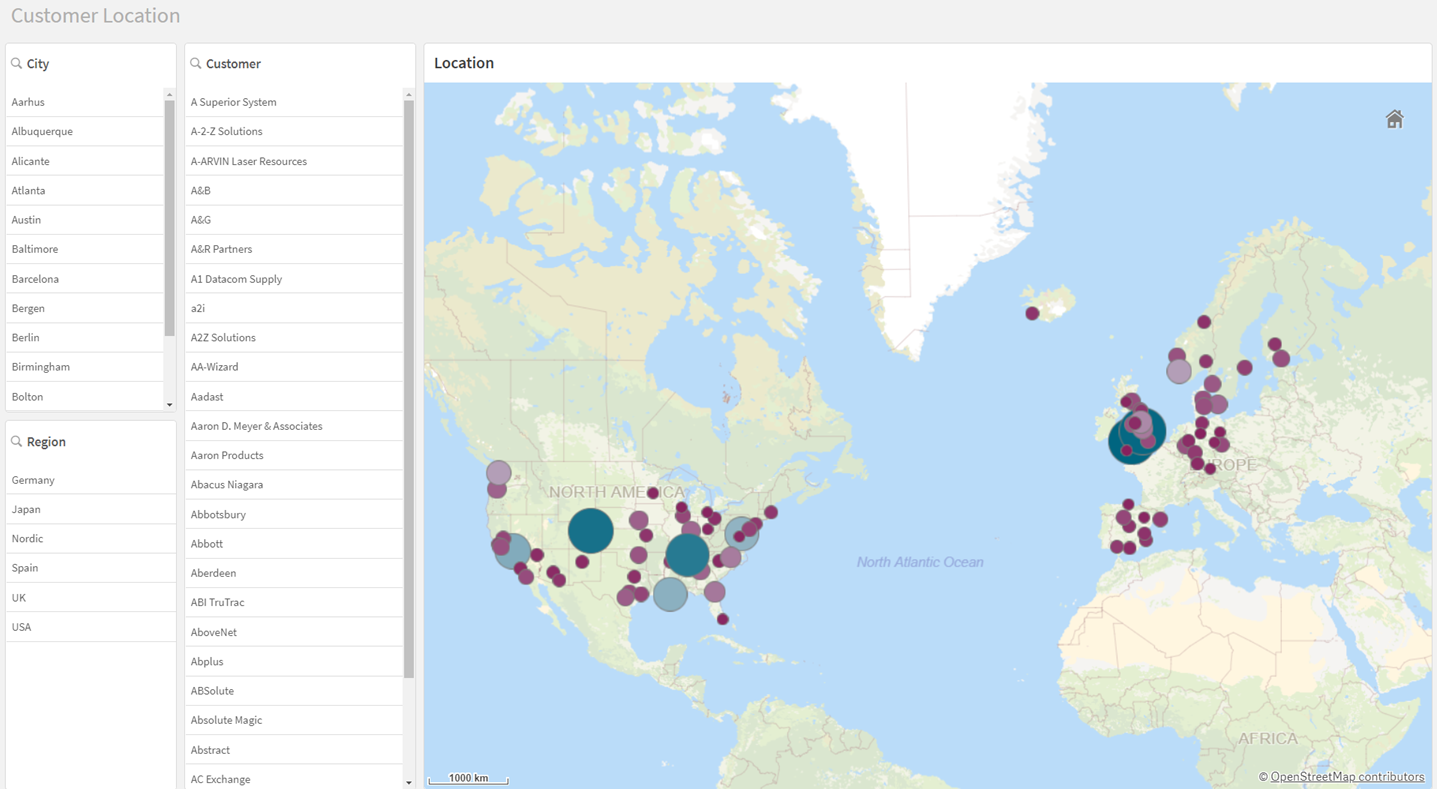
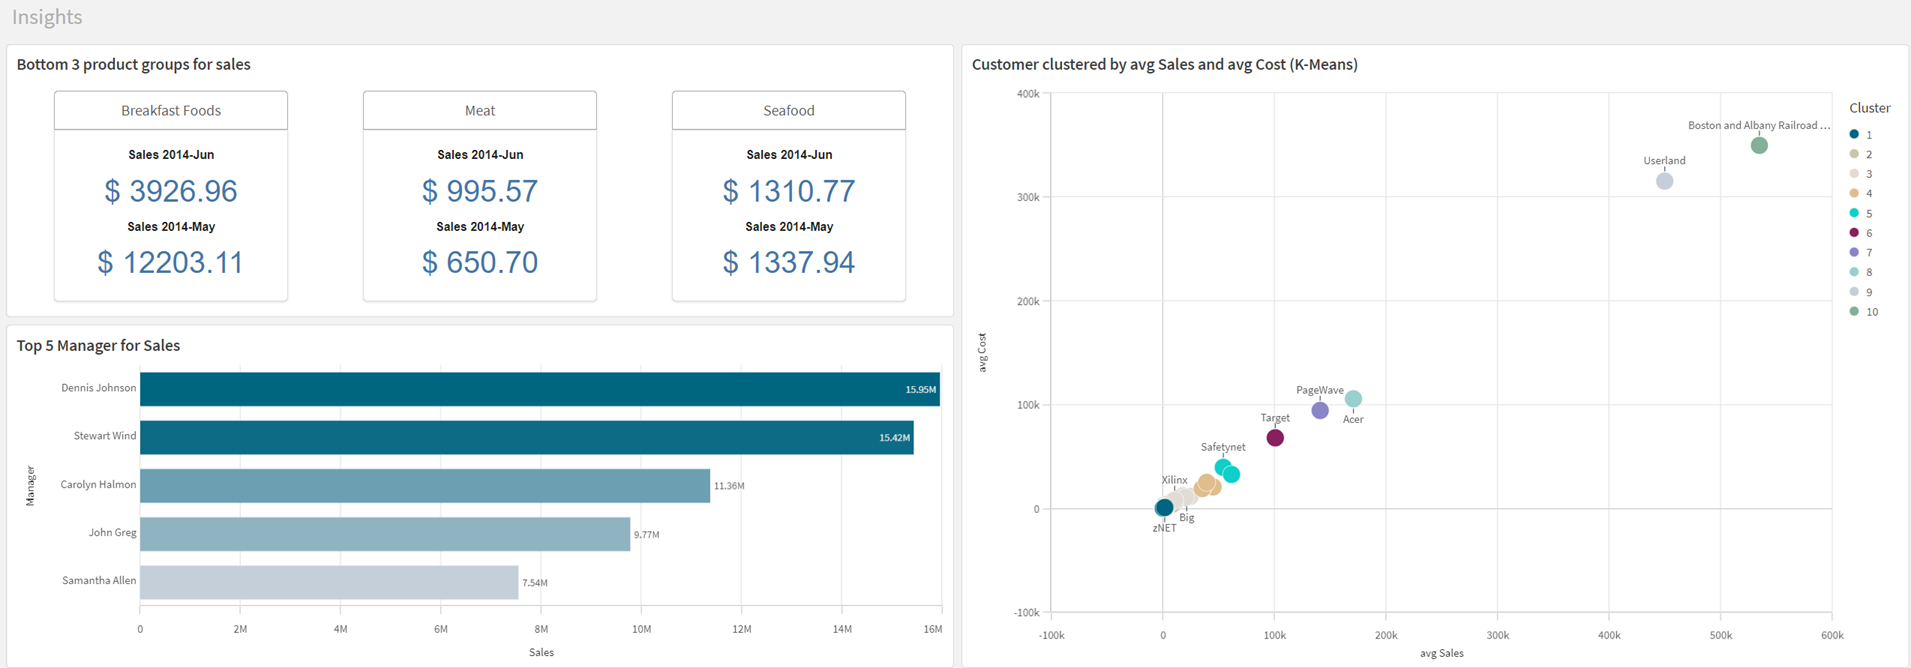
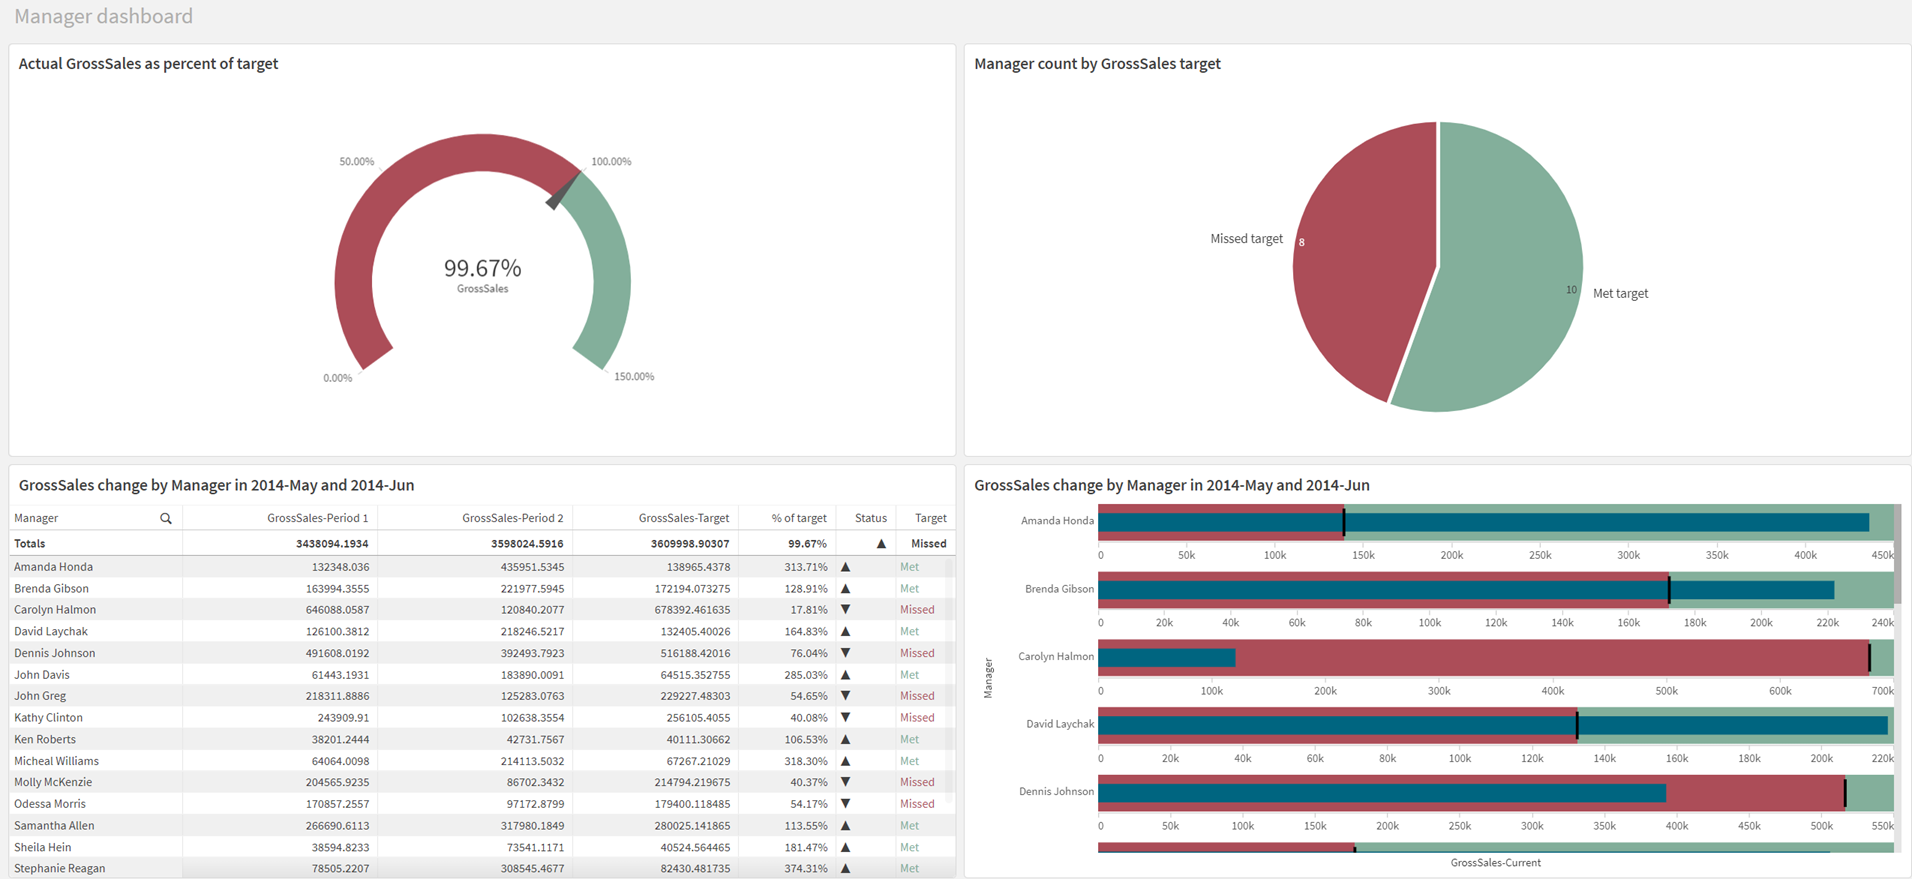

As you can see, there are similarities between the sheets. The first four all contain filter panes that are placed to the left. It is good to have consistency when you design an app. Insights and Manager dashboard break from this design as their role in this tutorial is to show different chart creation capabilities and advance analytics available through Insight Advisor . Similarly, Filters exists to show the different filters available in chart creation to limit the scope of data.
Visualizations that are present in several sheets should have the same position in all sheets so that the user knows where to find them. There should be a logic in the design that supports the user in achieving their goal of data discovery. Placement is one aspect of the design, another is the choice of visualization.
Each visualization has its own advantages, and to be able to build an efficient and well-functioning app, you need to be aware of those advantages. To some extent the visualizations are self-explanatory.
Graphical elements are great for giving overviews and showing trends, whereas tables are economical in that they can present large amounts of data using a limited space. You get exact figures, but lose the quick and easily digestible information that is conveyed in graphical elements.
Next, you will add visualizations to your first sheet.
Sheets are components of Qlik Sense apps. They present visualizations to app users so they can explore, analyze, and discover data. Sheets can be public or private.
Similar terms : Dashboard, worksheet
Visualizations are charts, extensions, and other objects that visualize your data for exploration in a sheet.
Similar terms : Chart
This term has several definitions:
Charts are objects where calculations, aggregations, and groupings can be made. Graphical visualizations, such as bar charts and pie charts are common examples, but also non-graphical objects such as pivot tables are charts.
A chart consists of dimensions and measures, where the measures are calculated once per dimensional value. If the chart contains multiple dimensions, the measures are calculated once per combination of dimensional values.
Similar terms : Visualization, Hypercube, Cube
Sheets are components of Qlik Sense apps. They present visualizations to app users so they can explore, analyze, and discover data. Sheets can be public or private.
Similar terms : Dashboard, worksheet
Visualizations are charts, extensions, and other objects that visualize your data for exploration in a sheet.
Similar terms : Chart